Housing Market Recovery Index Highlights – Week Ending July 25
- The realtor.com Housing Market Recovery Index reached 103.7 nationwide for the week ending July 25, posting a 2.7 point increase over last week and bringing the index 3.7 points above the pre-COVID baseline.
- Regionally, the West and Northeast continue to lead the recovery with the overall index now visibly above the pre-COVID benchmark.
- 30 of the largest 50 markets in the country are now above the recovery benchmark, with the overall index showing greatest recovery in New York, Boston, Seattle, Las Vegas and Philadelphia.
Download the full Housing Market Recovery Index dataset here.
National Recovery Trends
Real estate activity in the U.S. continues on an upward trajectory as we enter the middle of the summer. The realtor.com Housing Market Recovery Index reached 103.7 nationwide for the week ending July 25, posting a 2.7 point increase over last week and bringing the index 3.7 points above the pre-COVID baseline. The usual spring seasonal peak in May has shifted to August as buyers and sellers seek to emerge from the initial disruptions. As a result, measures of growth in the pace of sales, demand and price have surpassed last year levels. Growth in supply remains below seasonal normals but could reach recovery in the weeks to come. However, a sustained seller comeback still hinges on back-to-school plans and any potential lockdowns. The overall move above recovery was much needed and it will need to hold for at least another 10 weeks to make up for the lost activity in the second quarter of the year. A resurgence in COVID cases and lasting economic aftershocks pose a real upward hill for housing participants going into the fall.
| Week ending 7/25 | Current
Index |
w/w change | ||
| Overall Housing Recovery Index | 103.7 | +2.7 | ||
| Housing Demand Growth Index | 116.8 | +0.3 | ||
| Listing Price Growth Index | 105.5 | +0.1 | ||
| New Supply Growth Index | 96.8 | +3.9 | ||
| Pace of Sales Index | 104.5 | +4.9 |
The ‘housing demand’ component – which tracks growth in online search activity – remained visibly above recovery, with this week’s index reaching 116.8, up 0.3 points over the prior week.The demand index is now 16.8 points above the January baseline. The sustained, record-level homebuyer interest we’ve detected on realtor.com over the last two months has translated into higher activity this summer. Homebuyer sentiment appears to have fully recovered too, as lower mortgage rates have boosted consumer confidence. With supply levels low, this backlog of buyers portends increased competition and a shift toward a seller’s market.
Accordingly, the ‘home price’ component – which tracks growth in asking prices – increased by 0.1 points last week, and is now at 105.5, 5.5 points above the January baseline. With supply at record lows and buyer competition on the rise, sellers have regained leverage, enabling the fastest price growth recorded this year. As more offers come through this summer, we’ll get a good indication of whether higher asking prices will translate into higher selling prices. With supply limited, this is more likely.
Notably, the ‘pace of sales’ component – which tracks differences in time-on-market – saw continued signs of improvement for the sixth week in a row and is now above the pre-COVID baseline. The time-on-market index reached 104.5, up 4.9 points over last week, and now4.5 points above the January baseline, suggesting buyers and sellers are connecting at a faster rate.
The ‘housing supply’ component – which tracks growth of new listings – reached 96.8, up 3.9 points over the prior week and was just 3.2 points shy of the January growth baseline. Sellers continue to be cautious but are re-entering the market. However, further improvement could be constrained by lingering coronavirus concerns, and economic uncertainty going into the fall.
Local Recovery Trends
The West and Northeast lead the recovery
Regionally, the West (110.4) has overtaken all regions and now leads the recovery with the overall index now visibly above the pre-COVID benchmark. The Northeast (108.0) remains above recovery pace and continues to improve, while the South (99.5) and Midwest (99.0) are just below recovery.
COVID-19 containment, and economic resilience are key factors driving local differences in the housing recovery. Per our earlier research, the spread of COVID-19 is closely linked to the housing slowdown, with markets with higher cases per capita more likely to see a bigger impact on supply and the pace of sales. The speed and sustainability of the reopening, and each market’s ability to contain COVID-19, are dictating the speed of recovery across the regions. Finally, resilient economies may have an edge in the housing recovery, and areas with strong job markets before COVID-19, especially those with thriving tech sectors, are seeing buyers and sellers reconnect faster than the rest of the country.
| Region | Avg Recovery Index
(week ending 7/18) |
Weekly Change |
||||
| West | 110.4 | +4.9 | ||||
| South | 99.5 | +1.6 | ||||
| Northeast | 108.0 | +1.7 | ||||
| Midwest | 99.0 | +1.7 |
30 of 50 Largest Markets Now Above the Recovery Benchmark
Locally, an additional five markets have crossed the recovery benchmark this week, taking the total number of markets above the January baseline to 30, the highest since the early pandemic period. The overall recovery index is showing greatest recovery in New York, Boston, Seattle, Las Vegas and Philadelphia, with the components of growth surpassing or approaching pre-COVID benchmarks. Markets in the sunbelt (Florida, Georgia, Louisiana, Alabama) with re-emerging COVID concerns and parts of the midwest (Michigan, Indiana, Wisconsin) with vulnerable economies are failing to see material improvements.
In the ‘housing demand’ component, 47 of the 50 largest markets are positioned above the recovery trend. The most recovered markets for home-buying interest include Minneapolis, New York, Sacramento, Riverside-San Bernardino, and Oklahoma City, with a housing demand growth index between 135.1 and 148.8.
In the ‘home price’ component, more than half of markets are now positioned above the recovery trend, with 32 of the 50 largest markets seeing growth in asking prices surpass the January baseline, four more than the previous week. In the top 10 most-recovered markets, asking prices are now growing at 12 percent year-over-year, on average. The most recovered markets for home prices include Cleveland, Pittsburgh, Cincinnati, Louisville, and San Francisco, with a home price growth index between 106.6 and 113.7.
In the ‘pace of sales’ component, 34 of the 50 largest markets are now seeing the time on market index surpass the January baseline, up from 27 last week. In the top 10 most recovered markets for pace of sales, time-on-market is now down 19 percent, on average, year over year. Interestingly, markets where time on market is recovering the fastest tend to be faster moving than those with a slower recovery, suggesting seller markets pre-COVID may be better positioned for recovery in the months ahead. The most recovered markets for time-on-market include Boston, Philadelphia, Washington, Virginia Beach, and Seattle, with a pace of sales growth index between 119.6 and 135.8.
In the ‘housing supply’ component,19 of the 50 largest markets saw the new listings index surpass the January baseline, up from 16 last week. Interestingly, markets where new supply was improving the fastest tended to be higher priced than those that had yet recovered, suggesting sellers were returning faster in the more expensive markets. The most recovered markets for new listings included San Jose, New York, Seattle, San Francisco, and Las Vegas, with a new listings growth index between 129.2 and 136.8.
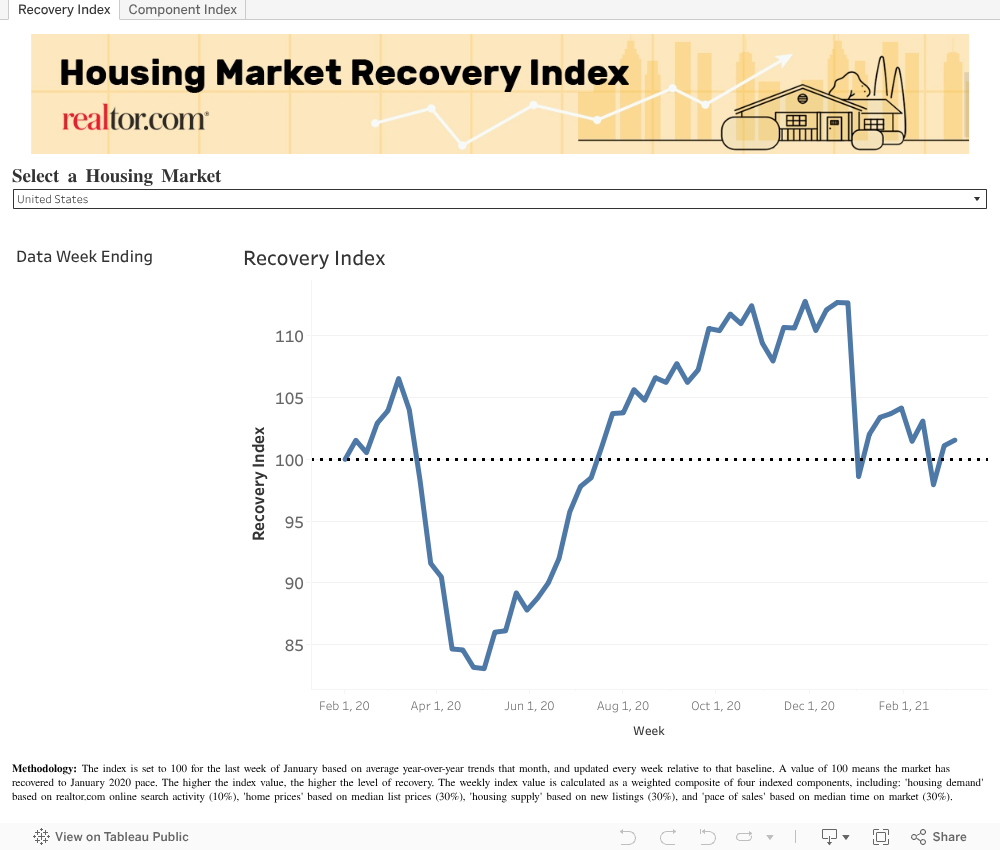
How to read the index – the overall index is set to 100 for the last week of January based on average year-over-year trends that month, and updated every week relative to that baseline. A value of 100 means the market has recovered to January 2020 pace. The higher the index value, the higher the level of recovery. The lower the index value, the lower the level of recovery.
Subscribe to our mailing list to receive monthly updates and notifications on the latest data and research.